This article was previously published in our August 2013 Newsletter
by Doug Smith, CEO
In this article we will breakdown some of the information provided in your EMSTesting.com Class Test Results.
First we will look at the Class Summative Results and what information you can obtain from this.
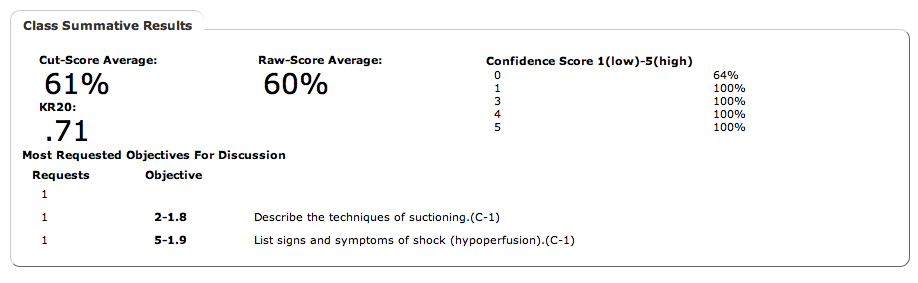
The class Cut Score average was 61% while the Raw Score average was 60%. This will often be the case that the cut score average will be higher. It just means the cut score of the test is lower than the published passing score. The Confidence Score gives a breakdown of scores when the student indicates what the confidence level he or she has when answering the question. You would like to see high confidence-‐high percentage indicates they know what they know and are confident. We know a student has reached success when the student is competent and confident.
The KR20 refers to the Kuder Richardson reliability calculation. This measures the internal reliability of a test (students who do well should score better on each item than students who do (poorly). Stated another way, how much can I trust the results of this test? The minimal acceptable score would be a 0.70. The highest this number can be is 1.00.
The remaining part of this screen shot involves requests to discuss in class based on objectives. In this example, you can see that the top request has no objective reference. From this we can assume this is a question that is based on an educational standard or Registry Practice and not on an old curricular objective.
Next we will examine the Individual Student Results Section.
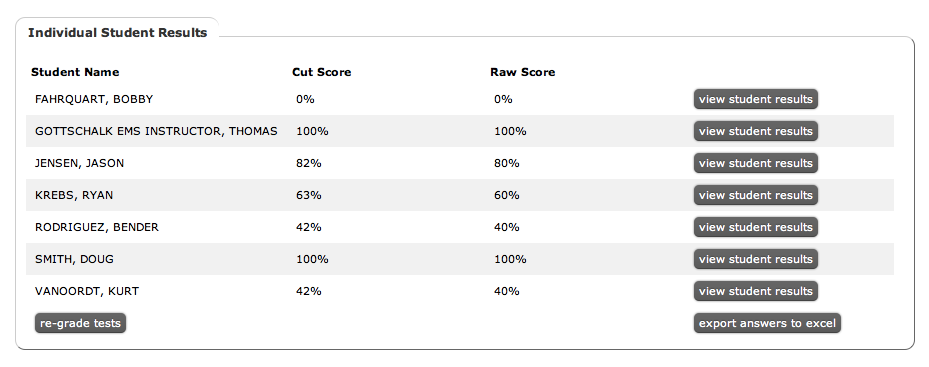
This table lists the students in alphabetical order. It provides both cut scores as well as raw scores. By selecting the “view student results” icon you will se exactly what the students see for results. There is also a “re-‐grade tests” icon that forces the tests to be regarded. This is needed when you had not set the grade book properly or changed an end time while the test was active. The “export answers to excel” gives a specific breakdown of each question each student answered. This will provide which question(s) the student asked to discuss or what level of confidence they indicated. It will also yield exactly when the question was answered.
The Class Detailed Results provides a tremendous amount of detail and actionable information.
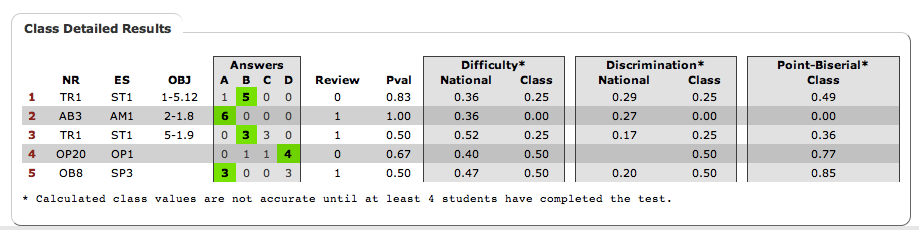
For each question we can see what the Registry reference, Educational Standard reference and Module-‐Topic-‐Objective reference was. A table of these references can be found in edit my questions, add question, the select the far right tab “EMS properties”. We can then see a breakdown of student responses with the green shaded area reflecting the correct answer. The next column indicates the number of times students requested that the particular question be reviewed in class. Note, you can just select the number of the question and a pop-‐up of that question will appear with all of the information provided. Pval represents the P-‐Value, which is just a decimal representation of the percentage of people taking the test who correctly answered the question. Difficulty just looks at the upper and lower performers and how they did on this question. You would like your difficulty number to be less than the National level. Discrimination also looks at the performance of the top and bottom. It looks at each question and calculates the number in the top performers who missed the question and calculates the number who missed in in the lower performers. It then calculates the mathematical difference between these two numbers and then divides this number by the total people in both groups. The expectation would be that the top performers would miss questions less often than the bottom performers, and if this were the case a positive discrimination would be the result. If the opposite occurs, the discrimination would result in a negative number and the question should be examined. The range of discrimination is from -‐0.5 to a +0.5. You desired result is that your discrimination is at or above the national discrimination and the closer to 0.5 the better.
Point-‐Biserial is similar to discrimination only it looks at all of the students’ performances and not just the top and bottom performers. This number can range from a -‐1.0 to a +1.0. Again your desired result would be a positive correlation and the closer to 1.0 the better.
Please contact Doug at doug@platinumed.com if you would like more detail regarding this article.